Playing The Commodity Craze
Note: This article originally appeared in the February 2008 issue of Registered Rep. magazine.
********************************************
What makes commodities so attractive to endowments? It's simple. Adding commodities to an equities portfolio reduces risk and increases returns. (It's Modern Portfolio Theory 101: By mixing asset classes with low correlations to one another in a portfolio, you actually reduce risk at the portfolio level while improving returns.) Recent research conducted by Ibbotson Associates, in fact, indicates that an optimized commodities allocation could have boosted portfolio returns over the past three decades by 133 basis points per annum. Ideal allocations for moderate-risk portfolios — analogous to a 60/40 equities-fixed income mix — range from 22 percent to 29 percent. For more conservative portfolios, the optimal exposure to commodities is 9 percent to 14 percent.
Up until two years ago, there were limited investment choices for those clients deemed suited for commodities. Besides a handful of very expensive mutual funds, there were commodity futures themselves. Nowadays there are more options. A half-dozen exchange-traded funds (ETFs) and exchange-traded notes (ETNs) have been recently launched, offering comparatively cheap and transparent exposure to broad-based commodity indexes. All tolled, some $5.3 billion is invested in these instruments.
How Futures Indexes Work
Investing in individual futures is a complicated process. Understanding how commodity indexes work can be tricky, too. Here's a quick down-and-dirty guide to commodity indexes' inner workings.
Commodity indexes represent the total return of a non-leveraged futures portfolio. Simply put, that means the full contract value — not just the margin requirement — nominally secures each position in the index calculation. (That's why index investors never worry about maintenance calls; the contracts are paid in full at the outset.)
Cash isn't used to initiate positions: Treasury securities — mostly short-term bills — collateralize the contracts. These securities provide an income stream that augments the gains, or offsets some of the losses, realized by the futures positions.
ETFs and ETNs track “long-only” indexes; there's no short selling. To maintain constant exposure, index rules call for futures positions to be rolled forward as they approach their delivery months. Thus, these benchmarks represent a sort of “buy-and-hold” investment strategy. Rolling futures forward also provides another form of return to the index investor — the so-called “roll yield” — which is sometimes positive, sometimes negative.
If the market for a given commodity is “normal,” near-term contracts will be priced lower than later deliveries. Gold for February delivery, for example, may be priced at $875 an ounce, while April gold commands $883 an ounce. The $8-per-ounce differential represents the cost of carrying the bullion for two months. Carry charges are mostly made up of storage and insurance paired with financing expenses. A word used to describe this price relationship — near-term deliveries lower than deferred deliveries — is contango. The existence of contango indicates, among other things, that there are adequate supplies to be carried into future months. If the deferred futures price is sufficiently higher than the nearby price, the spread actually represents an investment return, allowing speculators to buy gold in the near term, carry it into the future and redeliver through futures at a guaranteed price.
If you were to roll a long gold position from February to April now, you'd have to sell the near-term contract at $875, and buy the deferred contract at $883 for an expense of $800 ($8-per-ounce times the 100-ounce contract size). Rolling forward thus costs you the equivalent of 5.5 percent per annum. For the gold position to contribute a positive return to a commodity index, the interest income from the collateral, together with the capital appreciation realized from buying and selling February gold contract, must exceed 5.5 percent on an annualized basis. When markets are in contango, the roll yield for long positions is negative, dampening index returns.
Crude oil, a market often beset with fears of supply shortages, isn't presently a carrying-charge market. The market for crude, in fact, often suffers from backwardation, where prices for near-term deliveries are higher than those of deferreds. When, for example, February crude trades at $97 a barrel, $1 higher than the price for April delivery, the market is signaling supply concerns. By discounting the value of crude oil in the future, stock-building is discouraged, and inventories drop as refiners sell everything they have. Then, because inventories are so low, spot and near-term delivery prices are bid up.
Rolling a long position forward in an inverted market creates a positive roll yield. In the case of the February-April roll, for example, a 6.2-percent annualized yield could be obtained. Inverted markets thus boost index returns.
All tolled, a commodity index return is derived from three components: the interest earned on collateral deposited to secure futures positions, the return obtained from holding and trading futures themselves and the roll yield. Often, the roll yield is the single largest determinant of index returns.
To Each His Own
While each index purports to represent the commodities market as a whole, each is weighted differently, and each has different rules for rolling contracts forward. Returns, as a result, can vary significantly. Most indexes are production-weighted, so each commodity's weighting is based on the market value of producers' output. This is akin to weighting an equity index by market capitalization. Some index providers, however, think the economic significance of storable commodities is given short shrift when production numbers are relied upon solely as a yardstick, and use liquidity data as a balancing factor.
The S&P Goldman Sachs Commodity Index is a production-weighted benchmark of two-dozen commodities adjusted for liquidity. Currently, the SP/iGSCI is heavily weighted in energy products; 55 percent of the index's weight is given over to crude oil contracts alone. With futures on other petroleum products and natural gas tallied, energy futures makes up nearly three-quarters of the portfolio. Agricultural and soft commodities, such as wheat and sugar, make up 12 percent; metals 10 percent and livestock 3 percent.
Since SP/GSCI weights are based on world production, changes can be quite dramatic. Energy sector weights, for example, have varied between 44 percent to the current record of 75 percent. This can make the benchmark seem volatile when compared to other broad-based commodity indexes. This also makes SP/GSCI most susceptible to the effect of rotation between contango and backwardation in crude oil prices. In the summer of 2007, the crude oil market inverted, turning the roll yield from negative to positive. That allowed SP/GSCI-based products, which had been lagging those benchmarked to other commodity indexes, to race ahead. Two products, an iShares ETF (GSG) and an iPath ETN (GSC), are based upon SP/GSCI.
An enhanced version of SP/GSCI is the basis of a recently introduced exchange-traded note. The enhanced index was fashioned to mitigate the contango problem by setting parameters for rolling certain commodity positions into specific delivery months. Oil contracts, for example, may be rolled into deliveries several months out rather than the next active contract if contango is exceptionally high. Other selected commodities are rebalanced in accordance with seasonal factors.
The Dow Jones-AIG Commodity Index is made up of 19 commodities weighted primarily for trading volume, and secondarily based on global production. Index construction rules are designed to dampen volatility by setting floors and caps on component weights. In particular, no single commodity can comprise more than 15 percent of the index, and no single sector can make up more than a third of the benchmark's weight. By sectors, energy now carries the biggest weight of 33 percent, followed by metals at 27 percent; agriculturals and “softs,” e.g., coffee, cocoa and sugar, at 20 percent; livestock at 9 percent. The iPath family offers an ETN (DJP) based on the DJ-AIC.
The Rogers International Commodity Index is the broadest and most international of the indexes. RICI consists of 35 commodities, including such exotics as azuki beans, silk, rubber and wool. Weights are determined by a commodity's importance in international trade. Energy comprises 44 percent of the index; agriculturals and softs 32 percent; metals 21 percent and livestock 3 percent. ELEMENTS launched an ETN (RJI) tracking RICI in October 2007.
The Deutsche Bank Liquid Commodity Index consists of only six commodities, all are purported to be the most liquid in their respective sectors. The index provider claims this narrow field reduces frictional (roll and rebalancing) costs. Energy makes up 55 percent of DBLCI; agriculturals and metals equally split the remaining 45 percent. There is no exposure to livestock or softs in DBLCI. Energy positions are rebalanced monthly with rolls made into the most favorable delivery — contango-wise — over the ensuing 13 months, while other positions are rebalanced annually. Deutsche Bank claims the dual-rebalancing policy maximizes the return, or minimizes the costs, of the roll. DBLCI is the benchmark underlying the PowerShares DB Commodity Index Tracking Fund (DBC).
The Continuous Commodity Index is the original Commodity Research Bureau Index. The index is made up of 17 equal-weighted futures contracts. Sector wise, agriculturals and softs are the heftiest, comprising 47 percent of the benchmark's weight. Metals make up 24 percent, energy carries a weight of 18 percent and livestock weighs in at 12 percent. An exchange-traded fund based upon CCI (GCC) is registered now.
You Say ETF, I Say ETN
The list of broad-based commodity index products is made up of both exchange-traded funds and exchange-traded notes. Both offer transparent pricing and real-time trading; both are also marginable. These securities, however, differ in important ways.
ETFs are based upon open-ended portfolios comprised of actual futures contracts and collateral securities. Taxes become due at year end as if each contract comprising the index was liquidated on the last business day of the calendar year, and re-established on the first business day of the following year. Profits in open futures positions are thus taxed annually, and cannot be deferred into the following tax year. Interest income and capital gains or losses derived from the ETF portfolio's collateral securities are subject to ordinary tax treatment applicable to such holdings.
Exchange-traded notes are taxed quite differently. ETNs are senior zero-coupon debt instruments that pay a return based upon the performance of the underlying commodity index at maturity. ETNs are treated as prepaid contracts, which means tax consequences arise only upon the sale, redemption or maturity of the notes. If held to maturity (which may be as much as 30 years out), payment on the contract is dependent upon the appreciation or depreciation in the value of the underlying benchmark index, adjusted for annual expenses. ETNs do not distribute income. There is no tax consequence for holding a commodity ETN — only for selling or buying one in a closing transaction.
ETN and ETF investors take on decidedly different risk exposures, too. An ETF is only as good as its ability to track its target index faithfully. Tracking risk, though generally small, is borne by investors who are dependent upon fund sponsors to minimize the error (which is done by holding down operating expenses).
ETNs, on the other hand, don't suffer from tracking error — remember, there's no actual portfolio being managed. An ETN's day-to-day value, then, models its underlying index subject to the embedded expense ratio. Instead of tracking error, ETN investors assume credit risk — the risk that the issuer won't honor its payback promises. Essentially, it's a bet that the issuer will remain solvent for the length of the investor's holding period.
COMMODITY INDEX CHOICES
Benchmarks underlying existing and proposed commodity index products, include:
- Commodity Research Bureau Continuous Commodity Index [CCI]
- S&P Goldman Sachs Commodity Index [SP/GSCI]
- Dow Jones-AIG Commodity Index [DJ-AIGCI]
- Rogers International Commodity Index [RICI]
- Deutsche Bank Liquid Commodity Index [DBLCI]
- CCI, first calculated in 1957, is the oldest commodity index.
- PGSCI was launched in 1992.
- DJ-AIGCI and RICI were developed in 1998 and 1999, respectively.
- DBLCI debuted in 2003.
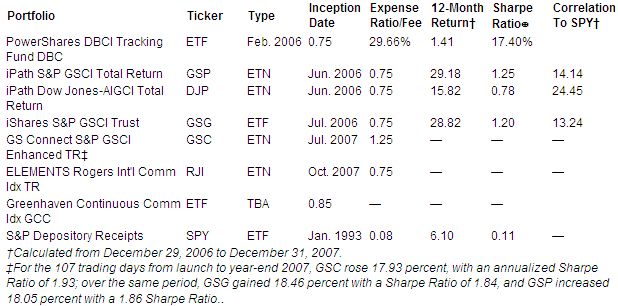
BROAD-BASED COMMODITY PORTFOLIOS VERSUS SPIDERS
At least some exposure to commodities can be salubrious to your client's portfolio by lowering risk AND increasing return.


Comments